Someone is lost in the wilderness. A drone can cover more ground in an hour than a ground team can in a day — but where should it look? That question is exactly what SAREnv helps answer, and it's why benchmarks matter: you can't improve search strategies if everyone measures against a different reality.Alguien se ha perdido en la naturaleza. Un dron cubre más terreno en una hora que un equipo terrestre en un día — pero ¿dónde debe buscar? Esa pregunta es la que SAREnv ayuda a responder, por eso los benchmarks importan: no puedes mejorar las estrategias si cada uno mide contra una realidad distinta.
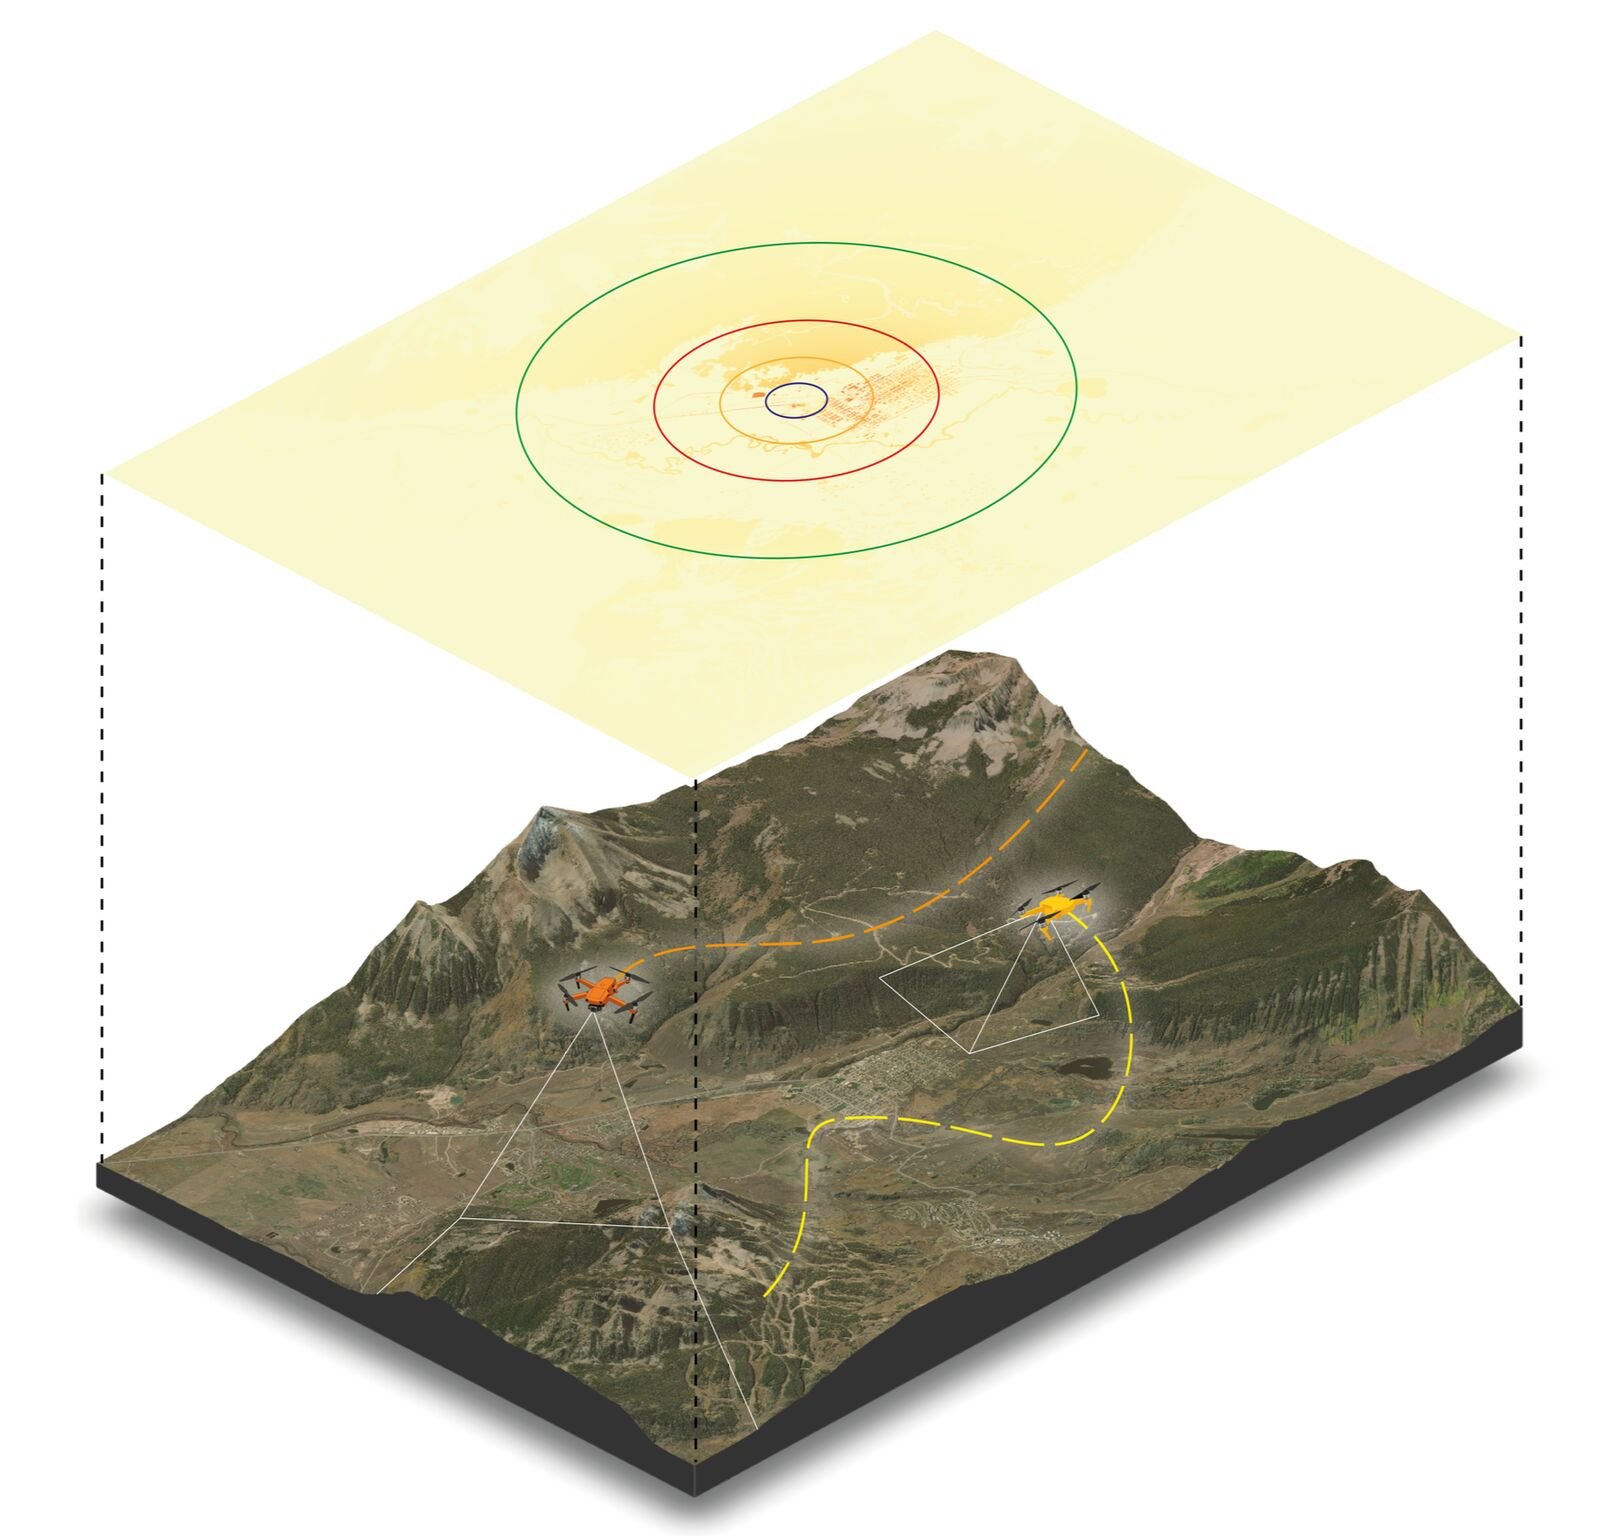
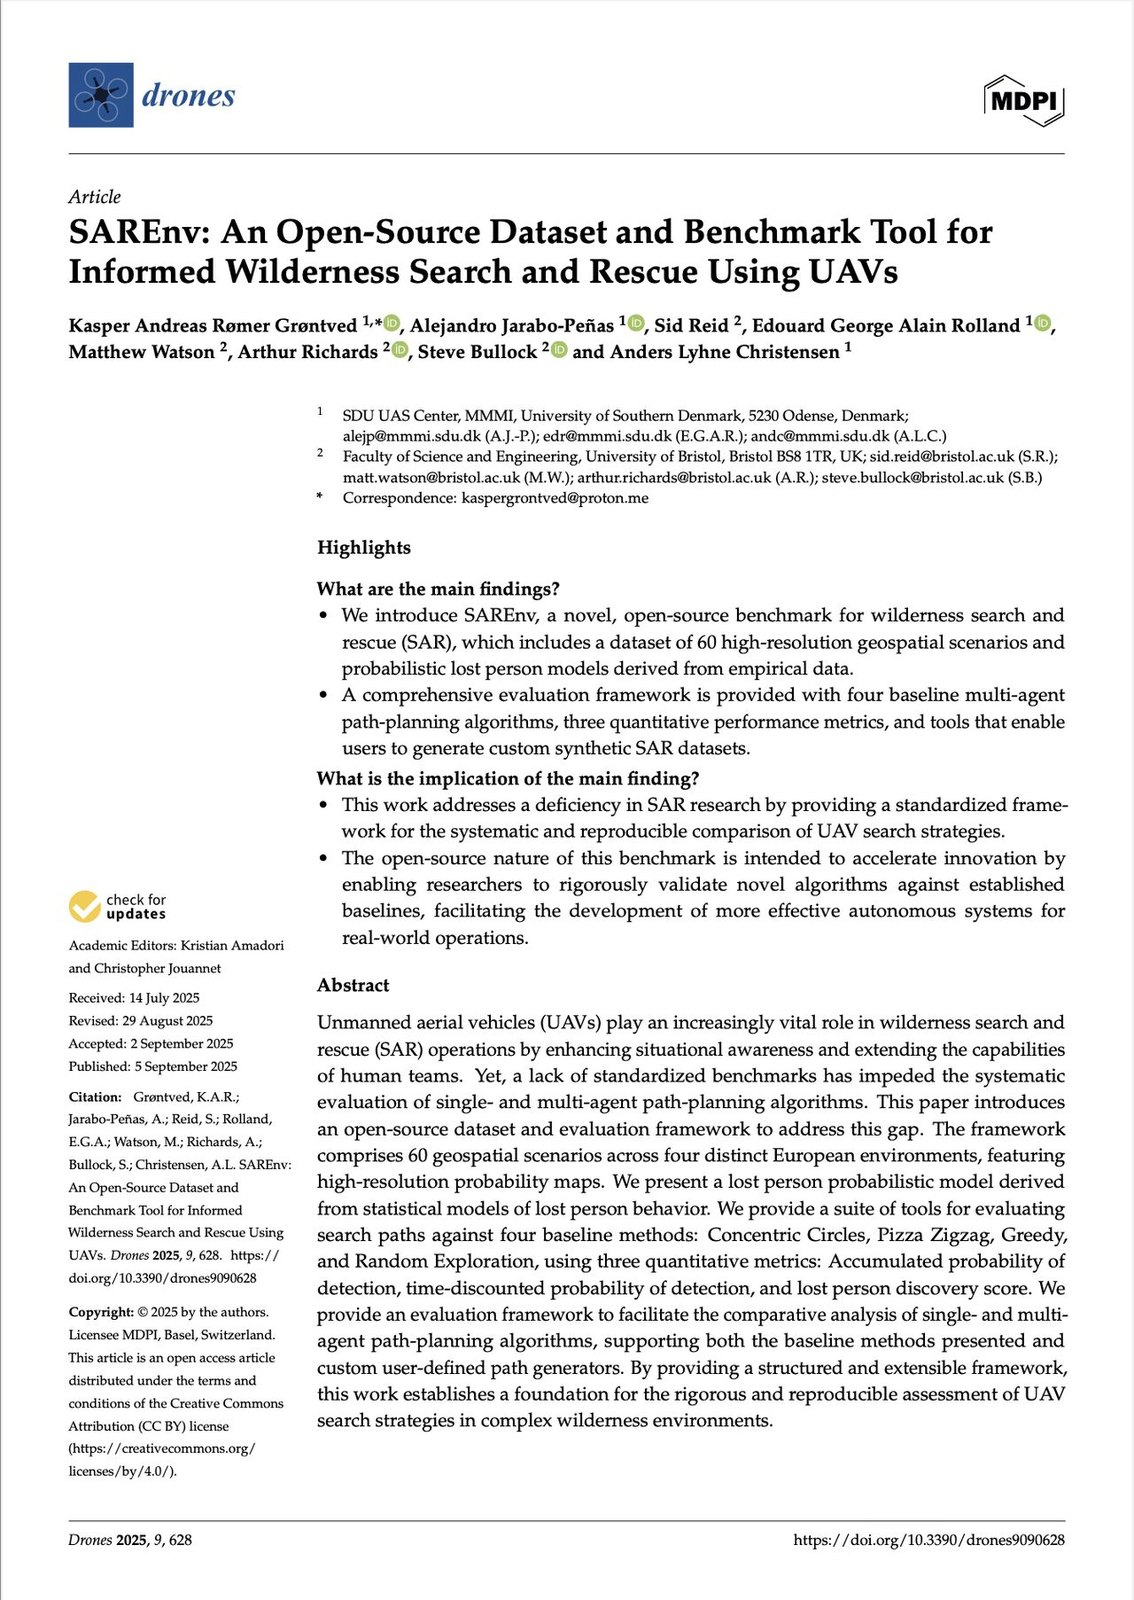
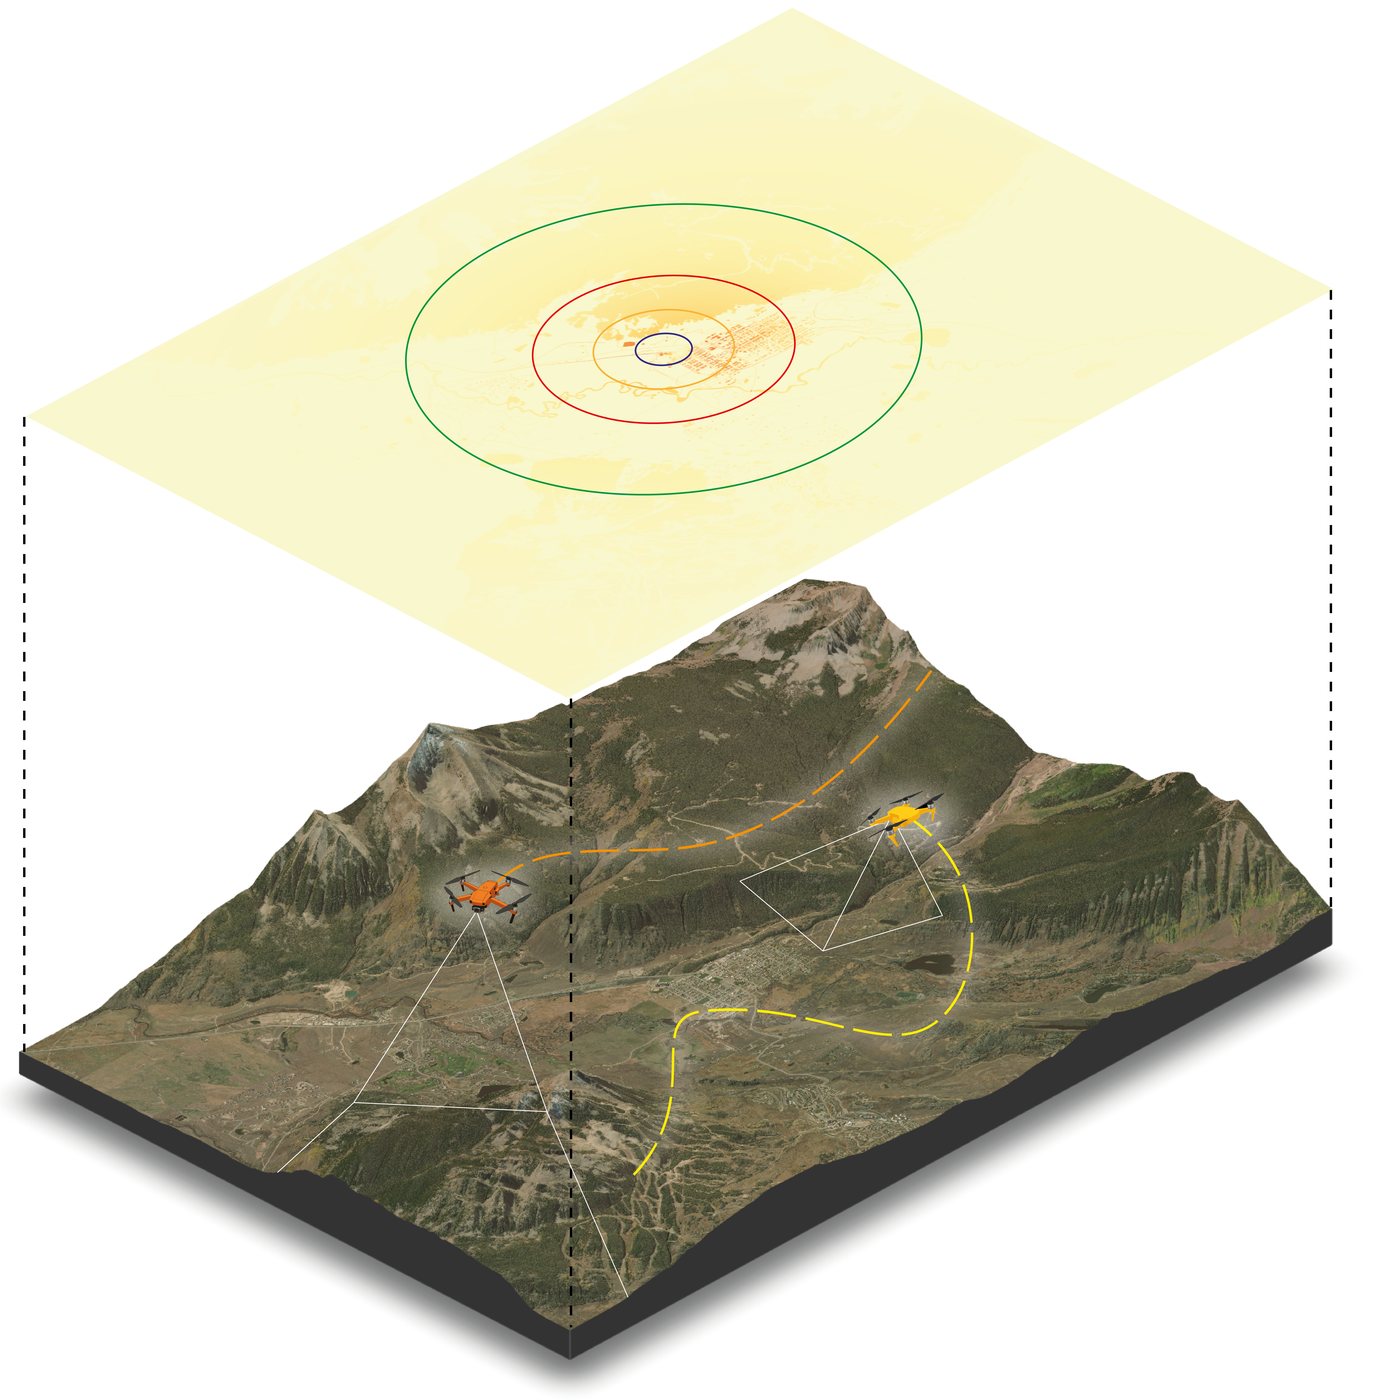
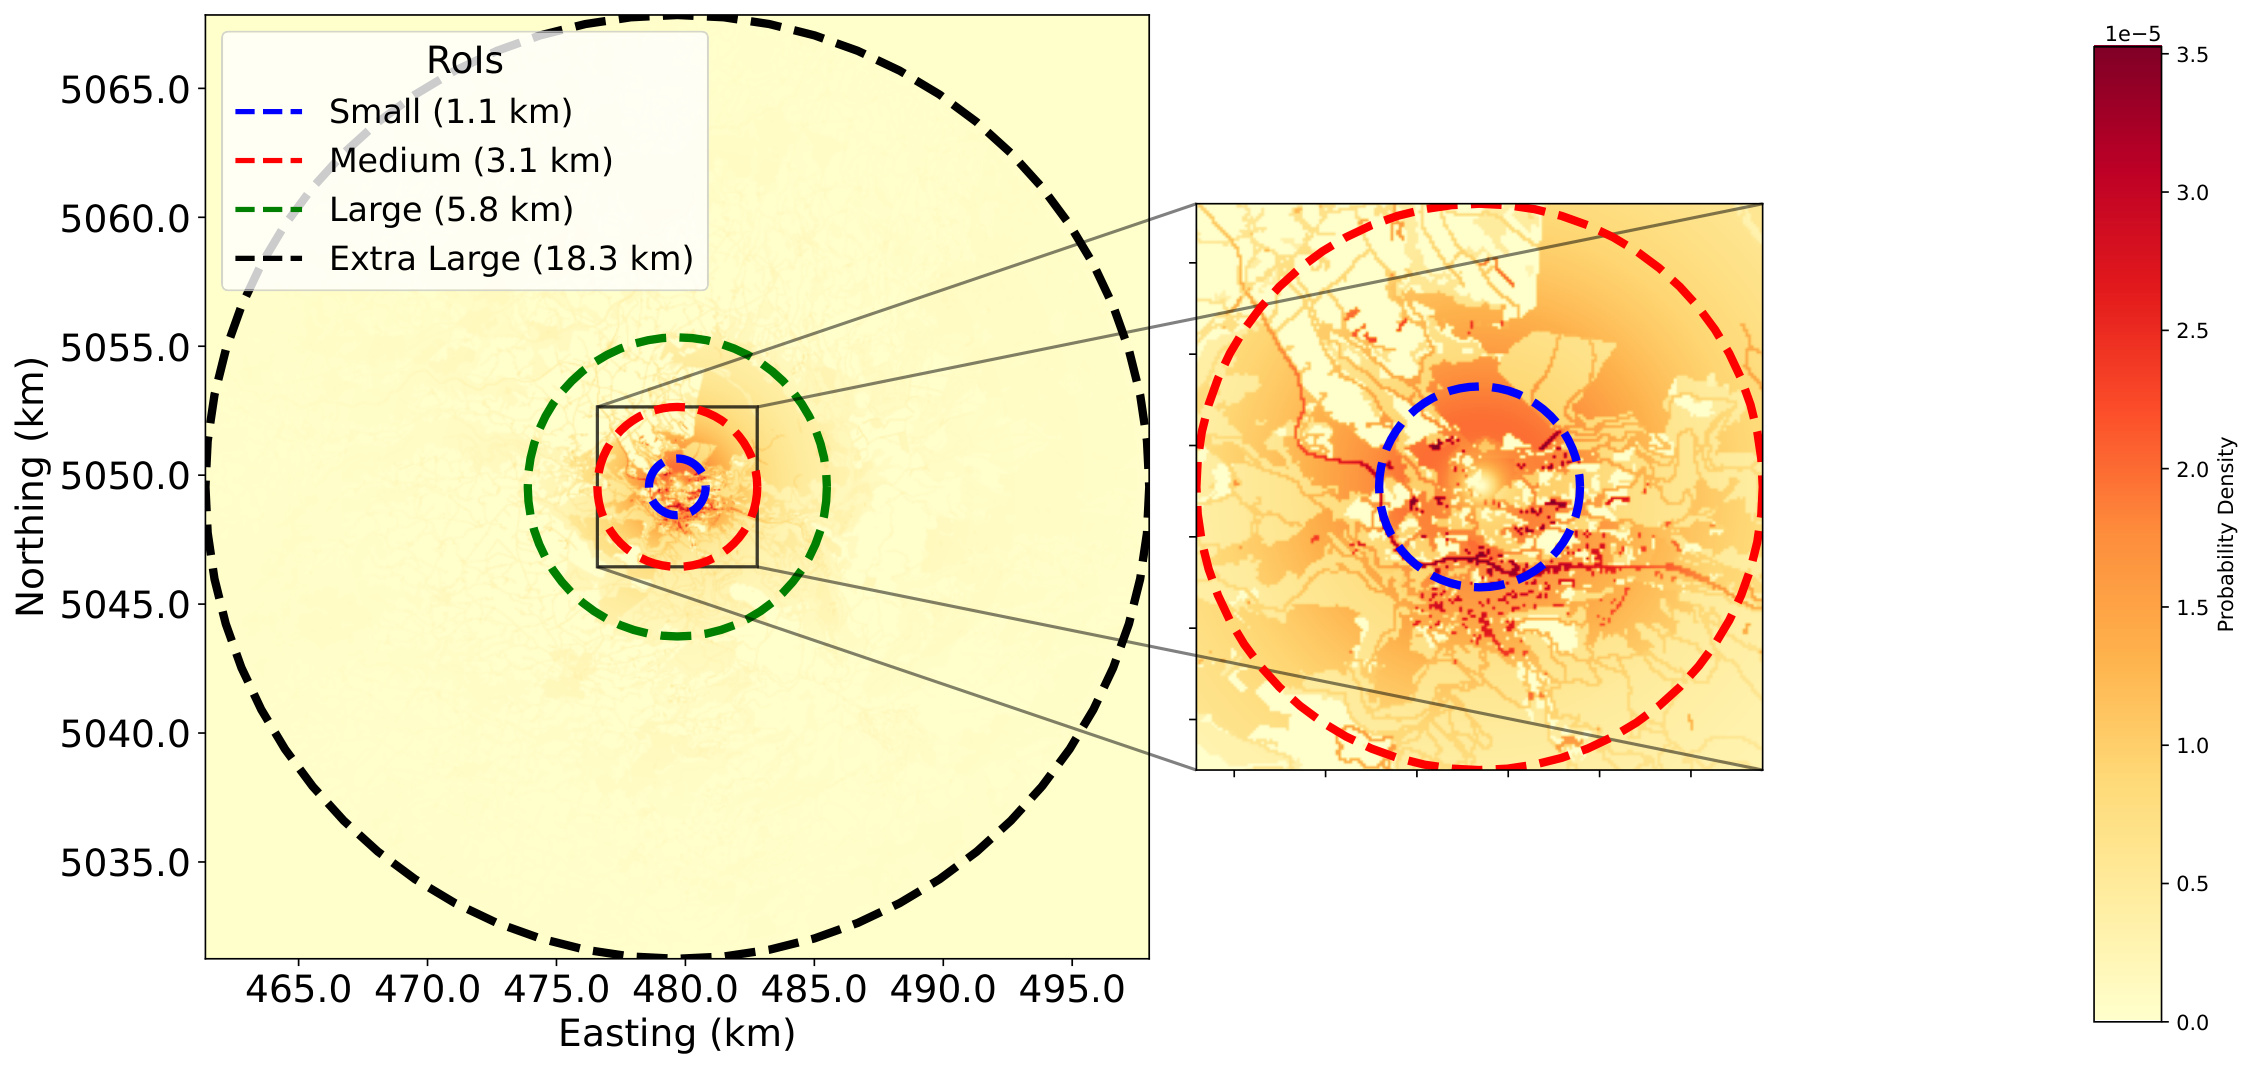
Published open-access in the journal Drones, SAREnv gives the UAV search-and-rescue community a shared dataset and evaluation framework for informed wilderness SAR planning. Figure 1 shows the environment model: four nested Regions of Interest centered on the Initial Planning Point, a probability map based on the lost person model, and potential search paths that exploit it.Publicado en acceso abierto en la revista Drones, SAREnv da a la comunidad de SAR con UAV un dataset y framework de evaluación comunes para una planificación informada del SAR. La Figura 1 muestra el modelo: cuatro Regions of Interest anidadas en torno al Initial Planning Point, un mapa de probabilidad basado en el lost person model y rutas que lo explotan.
Where do lost people actually end up?¿Dónde acaban realmente los perdidos?
The environmental model is grounded in empirical data from Lost Person Behavior (Koester, 2008), which establishes strong correlations between where people are found and specific terrain features. Table 1 reports the find-location distribution by feature class — linear features like trails and streams dominate, which is why SAREnv buffers them into searchable two-dimensional areas.El modelo de entorno se basa en datos empíricos de Lost Person Behavior (Koester, 2008), que establece fuertes correlaciones entre dónde se encuentra a las personas y características concretas del terreno. La Tabla 1 muestra la distribución de hallazgos por clase: dominan las lineales, como senderos y arroyos, por eso SAREnv las convierte en áreas bidimensionales buscables.
| Find Location (%) | Temperate | Dry |
|---|---|---|
| n | 312 | 196 |
| Structure | 13% | 10% |
| Road | 13% | 17% |
| Linear | 25% | 31% |
| Drainage | 12% | 18% |
| Water | 8% | 9% |
| Brush | 2% | 2% |
| Scrub | 3% | 3% |
| Woods | 7% | 6% |
| Field | 14% | 1% |
| Rock | 4% | 2% |
Based on empirical data from Lost Person Behavior (Koester, 2008): linear features dominate (25–31%).Datos empíricos de Lost Person Behavior (Koester, 2008): dominan las lineales (25–31%).
Nested regions of interestRoIs anidadas
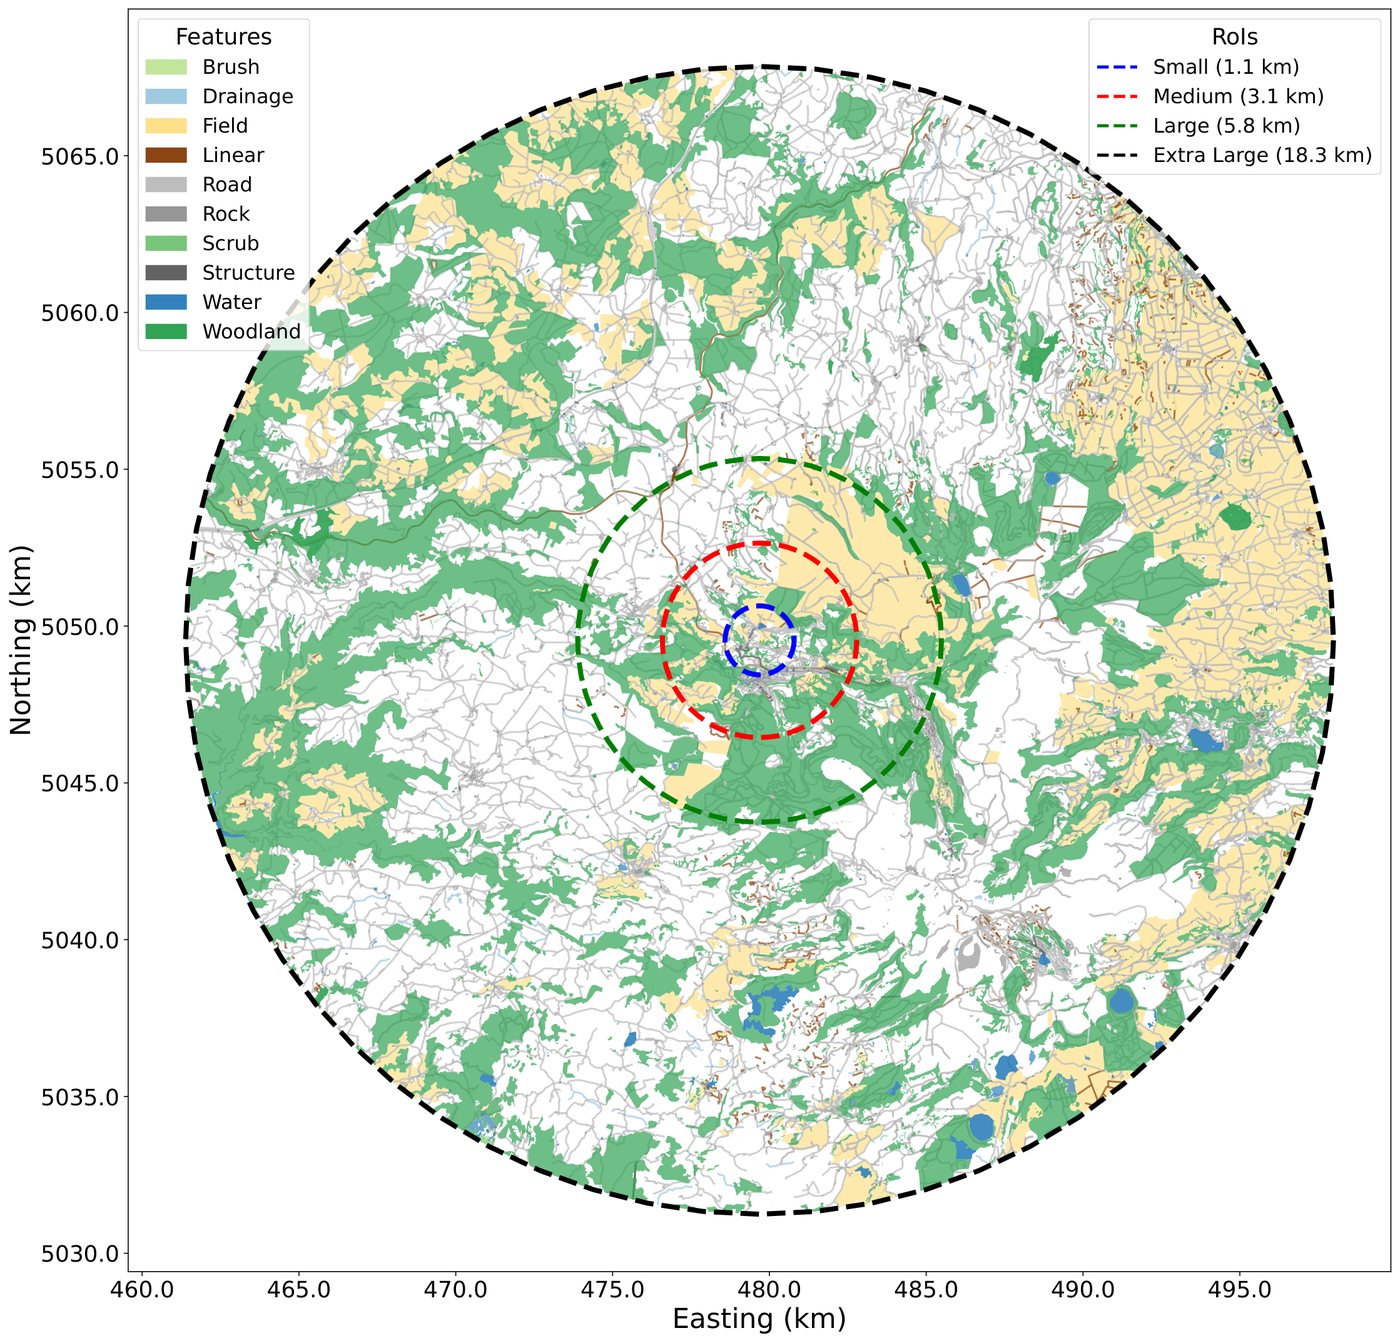
RoIs are circular areas centered on the Initial Planning Point, with sizes statistically derived from dispersal patterns. Table 2 defines the four nested RoIs (small, medium, large, extra large) for each environment type — the extra-large RoI can reach a 19.3 km radius (1170 km²). Figure 2 visualizes the polygonal features extracted within the extra-large RoI of a temperate-mountain environment (dataset #19).Las RoIs son áreas circulares centradas en el Initial Planning Point, con tamaños derivados estadísticamente de la dispersión. La Tabla 2 define las cuatro RoIs anidadas (small, medium, large, extra large) por tipo de entorno — la RoI extra-large llega a 19.3 km de radio (1170 km²). La Figura 2 visualiza las características poligonales de la RoI extra-large de un entorno templado-montañoso (dataset #19).
| Horizontal distance from the IPP* | Temp. Mountains | Temp. Flat | Dry Mountains | Dry Flat |
|---|---|---|---|---|
| n | 568 | 274 | 221 | 58 |
| Small | 1.1 (3.8) | 0.6 (1.1) | 1.6 (8.0) | 1.3 (5.3) |
| Medium | 3.1 (30.2) | 1.8 (10.2) | 3.2 (32.2) | 2.1 (13.8) |
| Large | 5.8 (105.7) | 3.2 (32.2) | 6.5 (132.7) | 6.6 (136.8) |
| Extra Large | 18.3 (1052.1) | 9.9 (307.9) | 19.3 (1170.2) | 13.1 (539.1) |
Shown in the format: radii (km) (area (km²)). Extra-large RoI up to 19.3 km radius (1170 km²).Formato: radios (km) (área (km²)). RoI extra-large de hasta 19.3 km de radio (1170 km²).
Generating realistic scenariosGenerando escenarios realistas
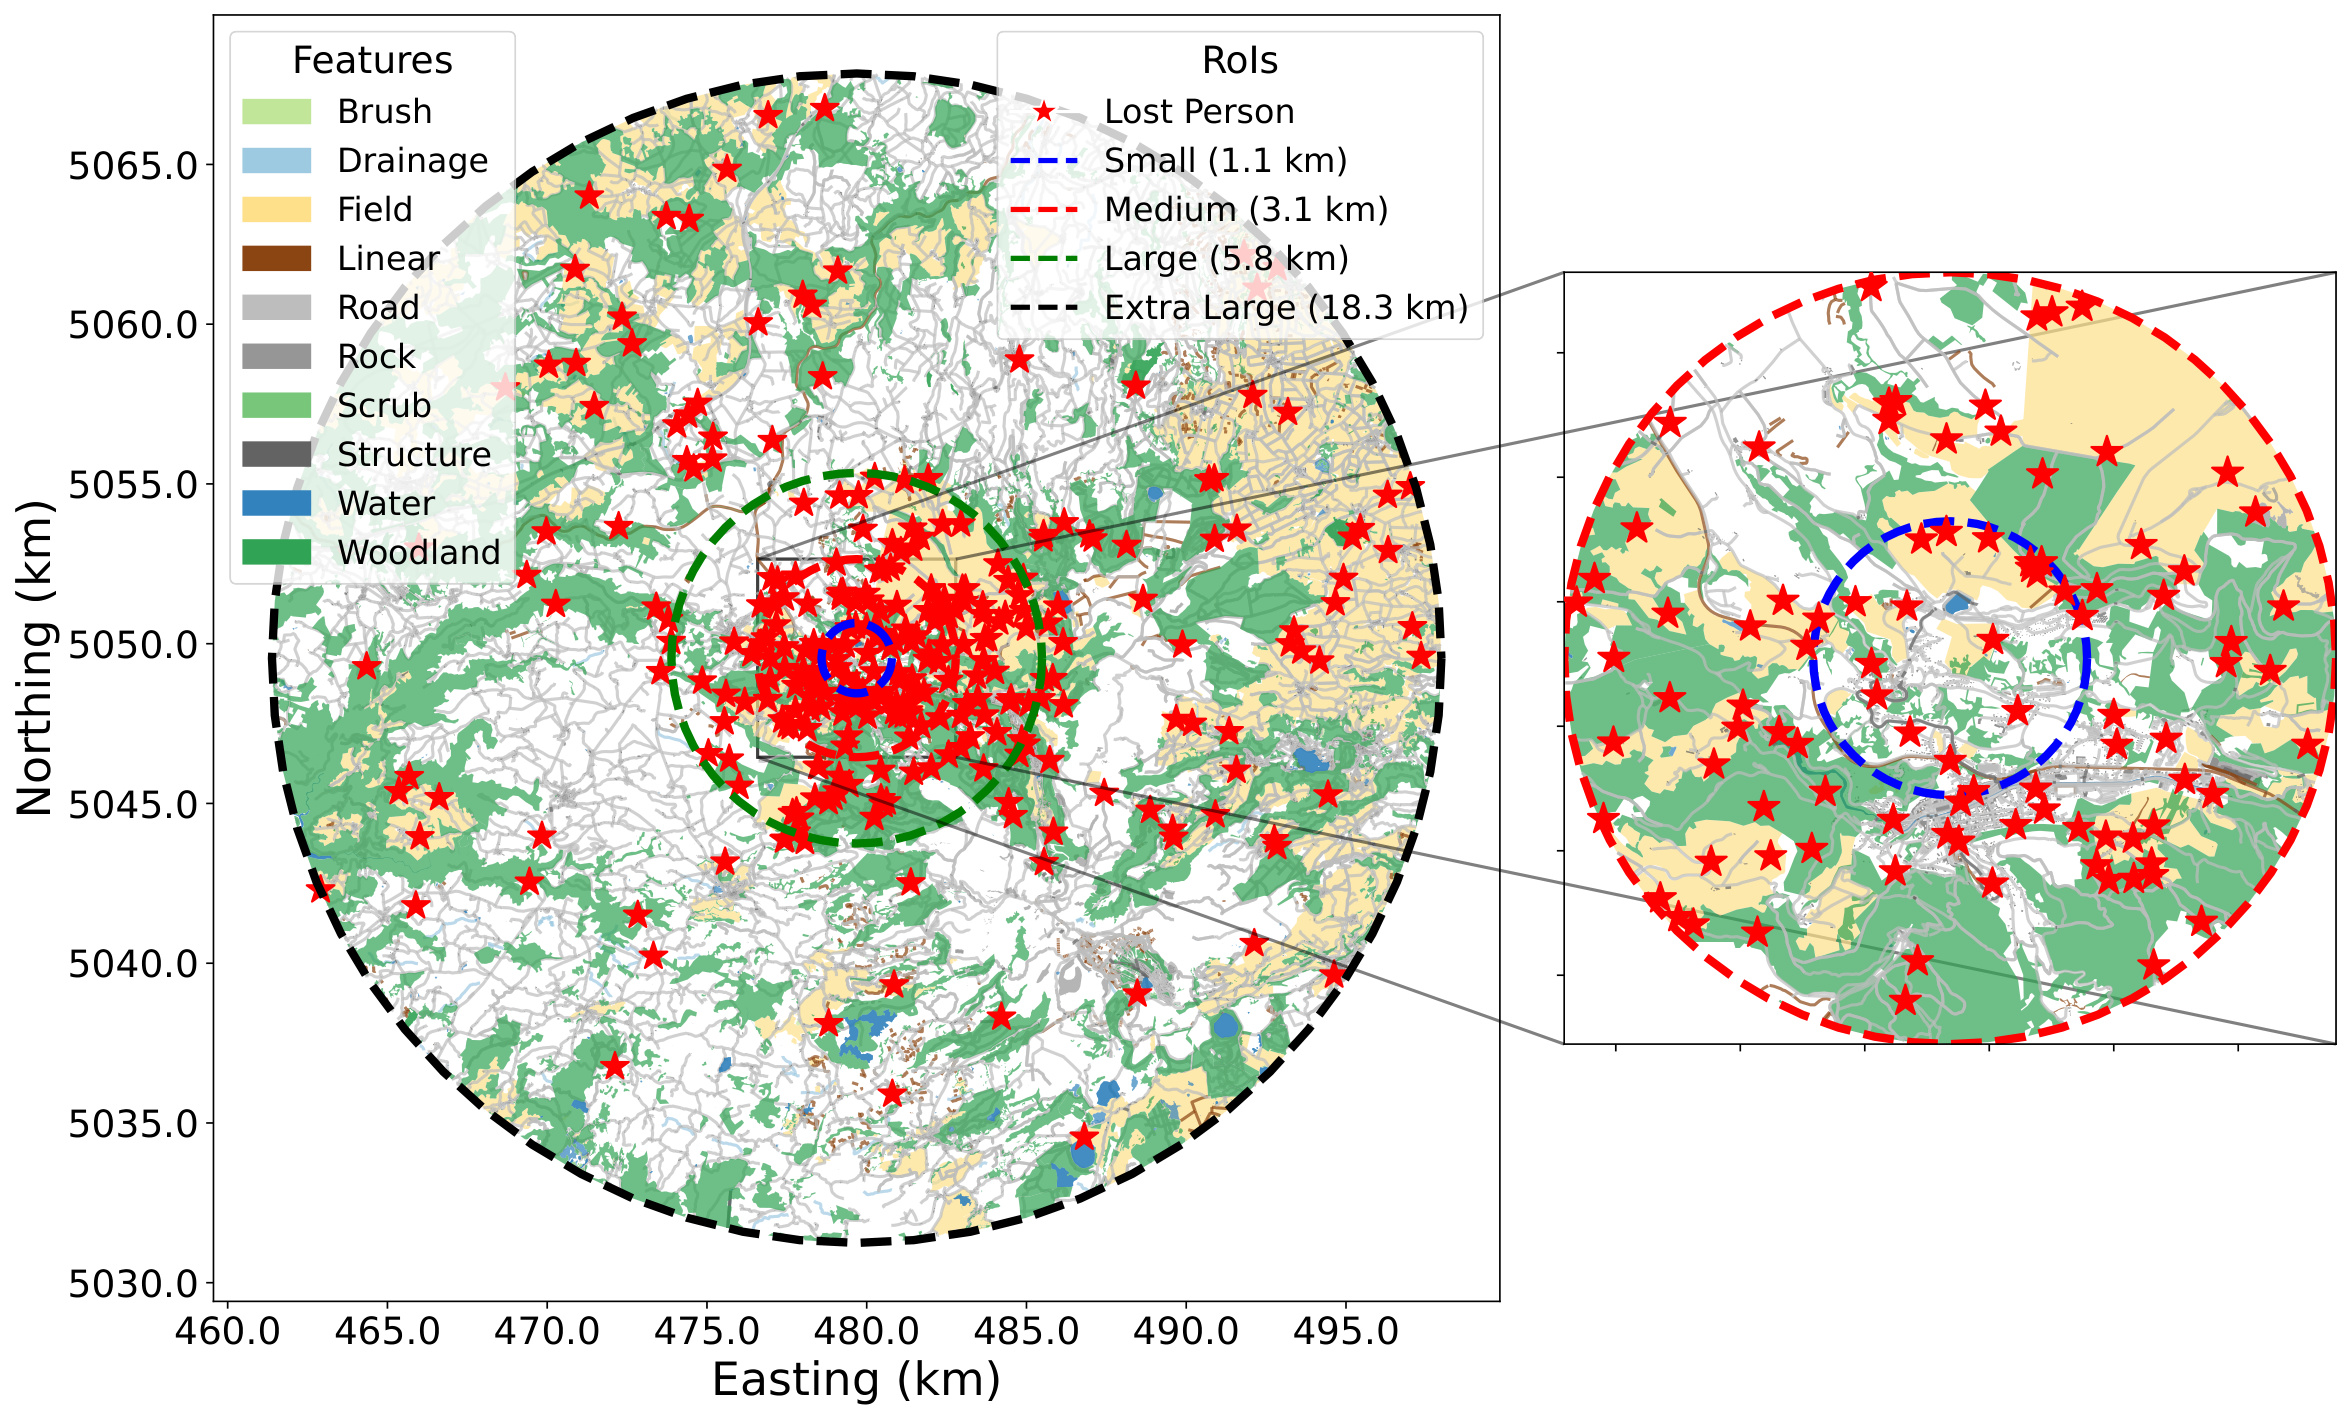
SAREnv generates lost-person locations that cluster in high-probability areas. Figure 3 shows the probability map of environment #19, and Figure 4 shows 300 generated locations distributed across the search environment.SAREnv genera ubicaciones de personas perdidas agrupadas en zonas de alta probabilidad. La Figura 3 muestra el mapa de probabilidad del entorno #19, y la Figura 4, 300 ubicaciones generadas por el entorno de búsqueda.
Comparing search strategiesComparativa de estrategias
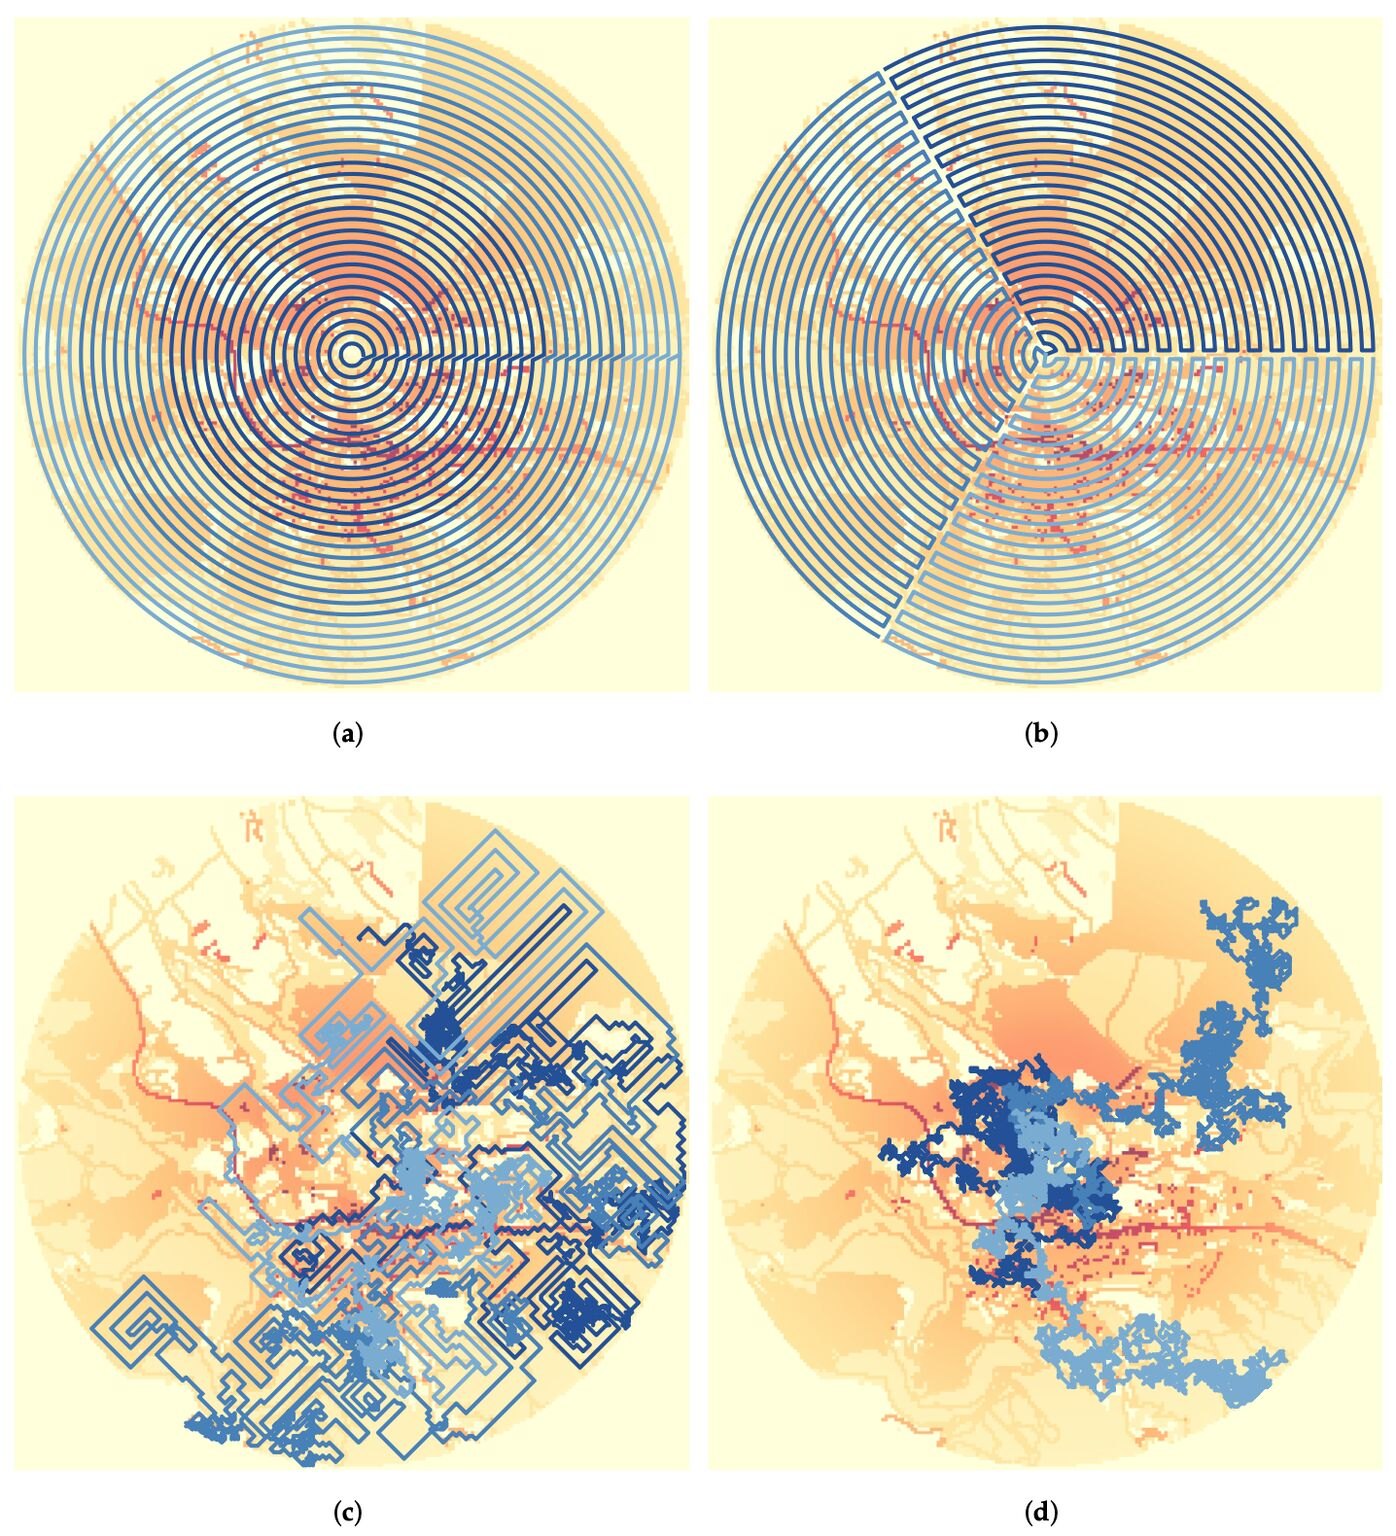
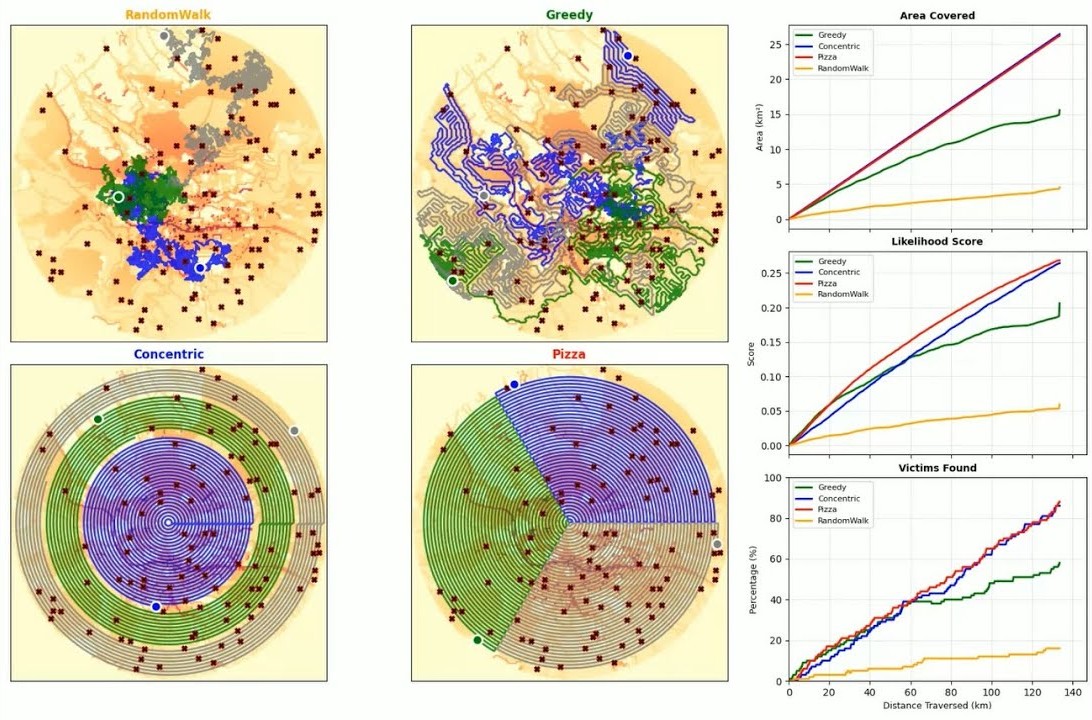
Four baseline path planners ship with the benchmark — Concentric Circles, Pizza Zigzag, Greedy, and Random Exploration — shown in Figure 5 over a medium probability heatmap. Search strategies can then be compared head-to-head on the same scenarios with three performance metrics.El benchmark incluye cuatro planificadores de rutas base — Concentric Circles, Pizza Zigzag, Greedy y Random Exploration — en la Figura 5 sobre un heatmap de probabilidad medio. Las estrategias se comparan cara a cara en los mismos escenarios con tres métricas de rendimiento.
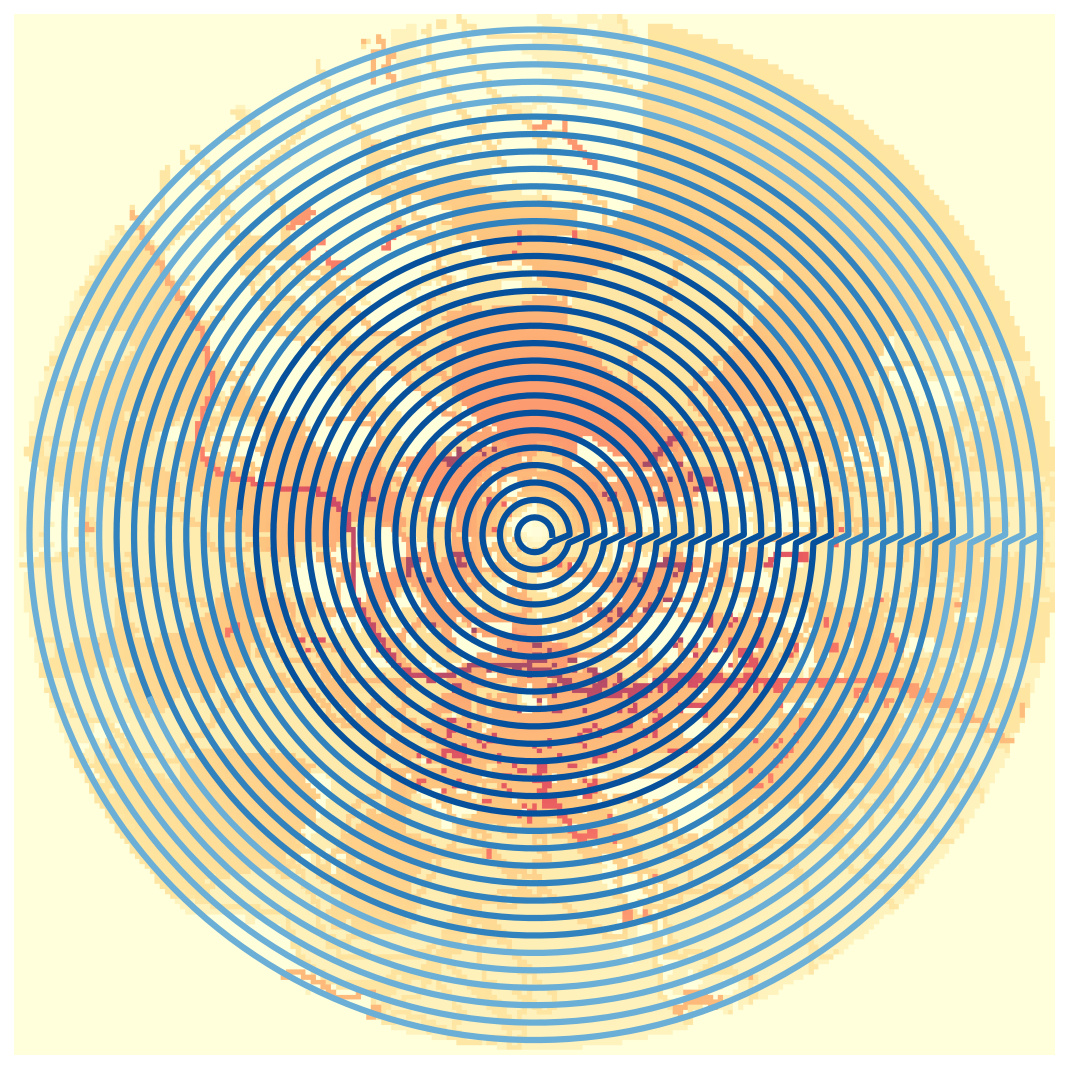
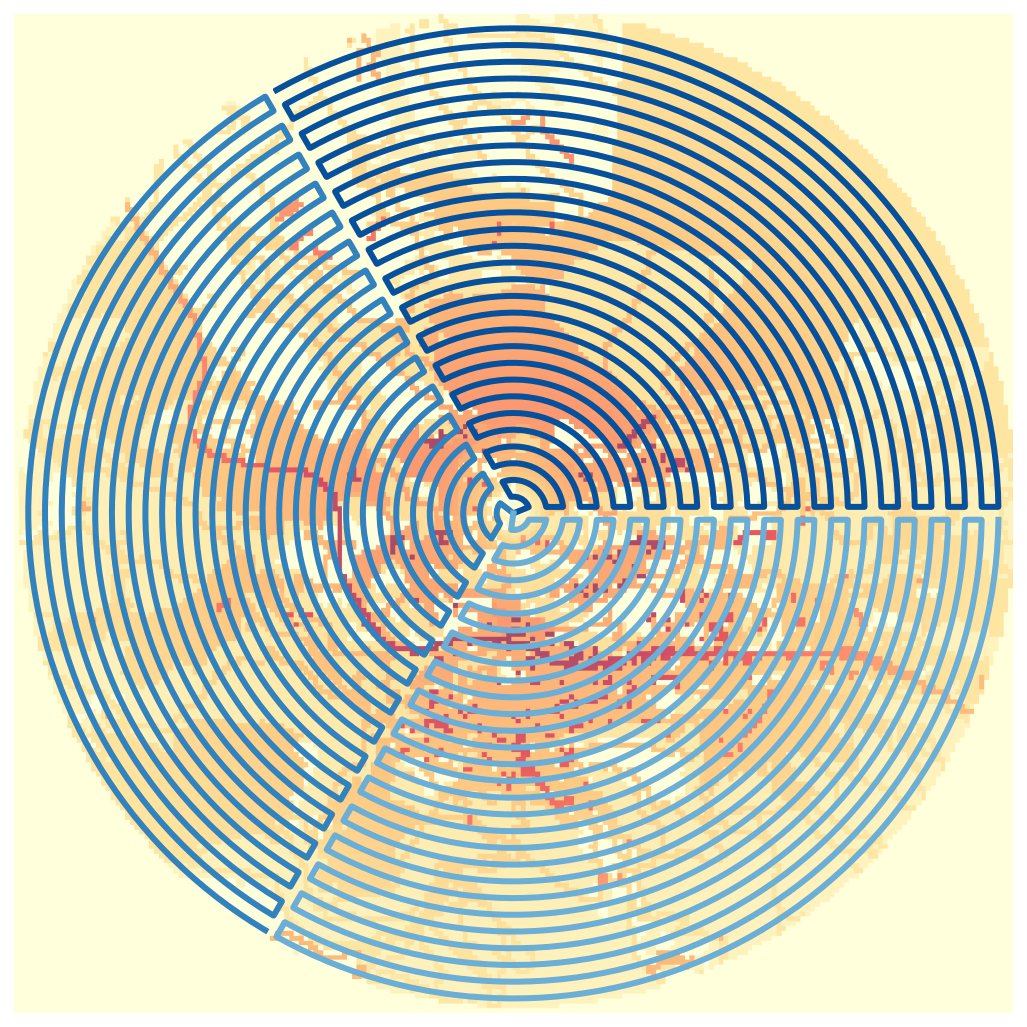
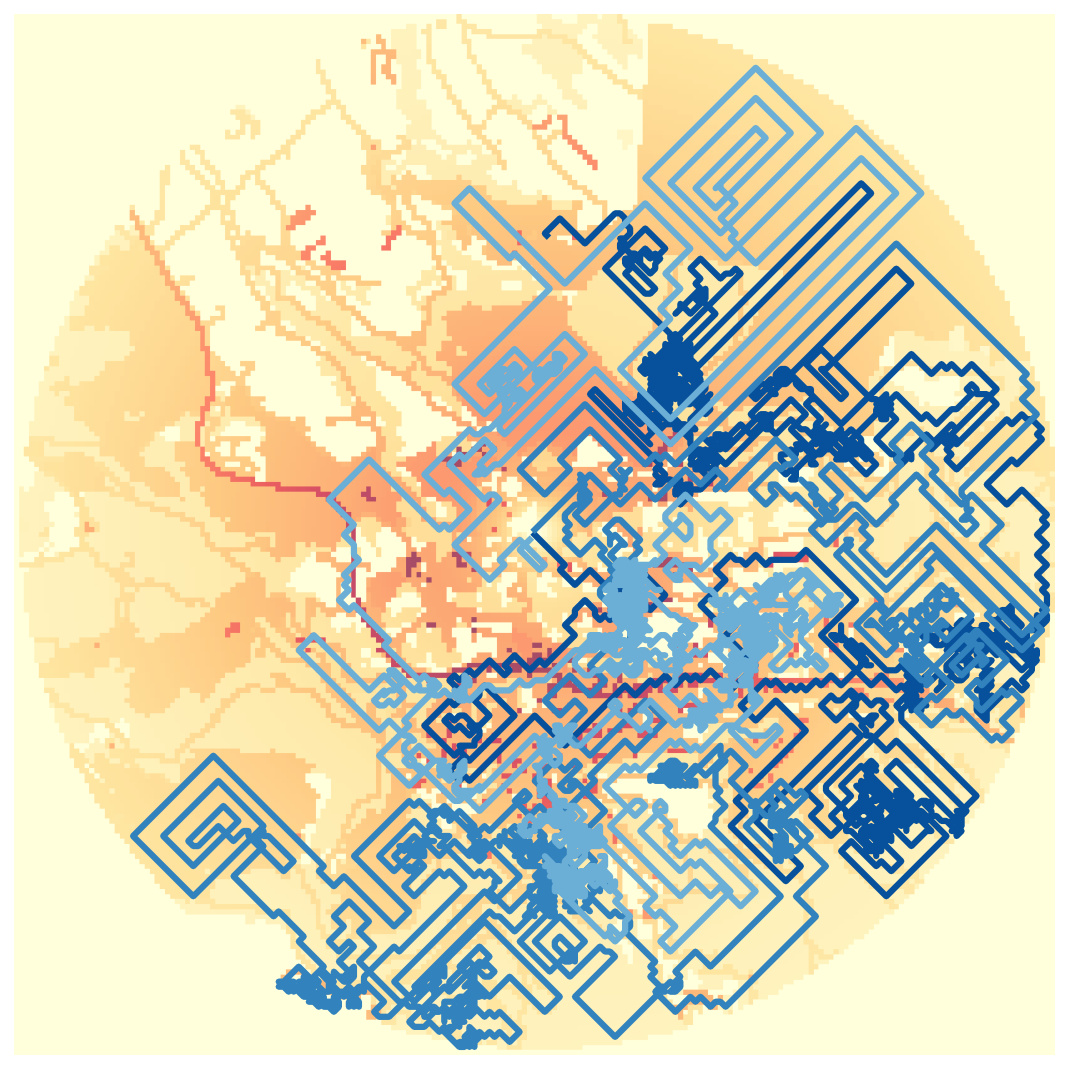
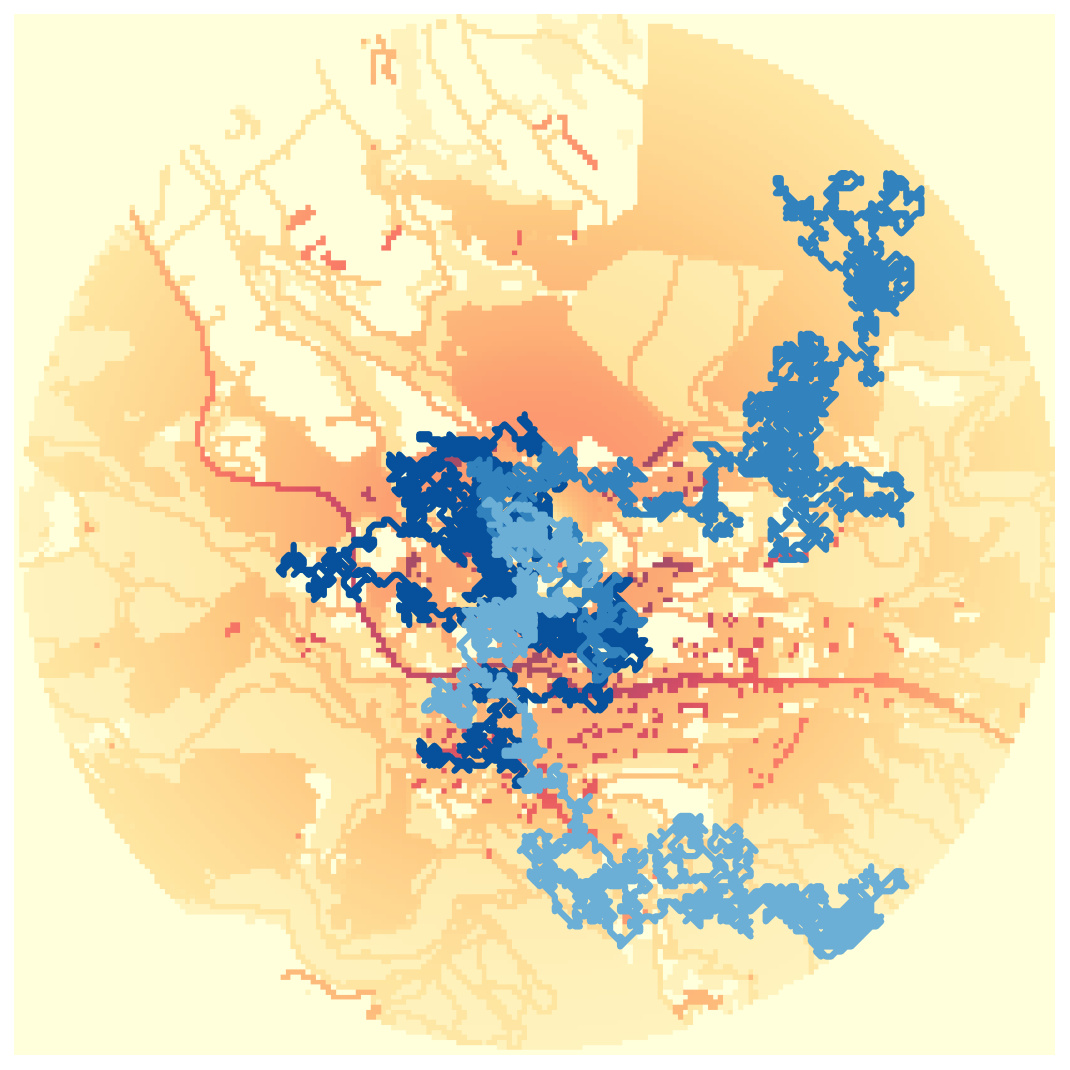
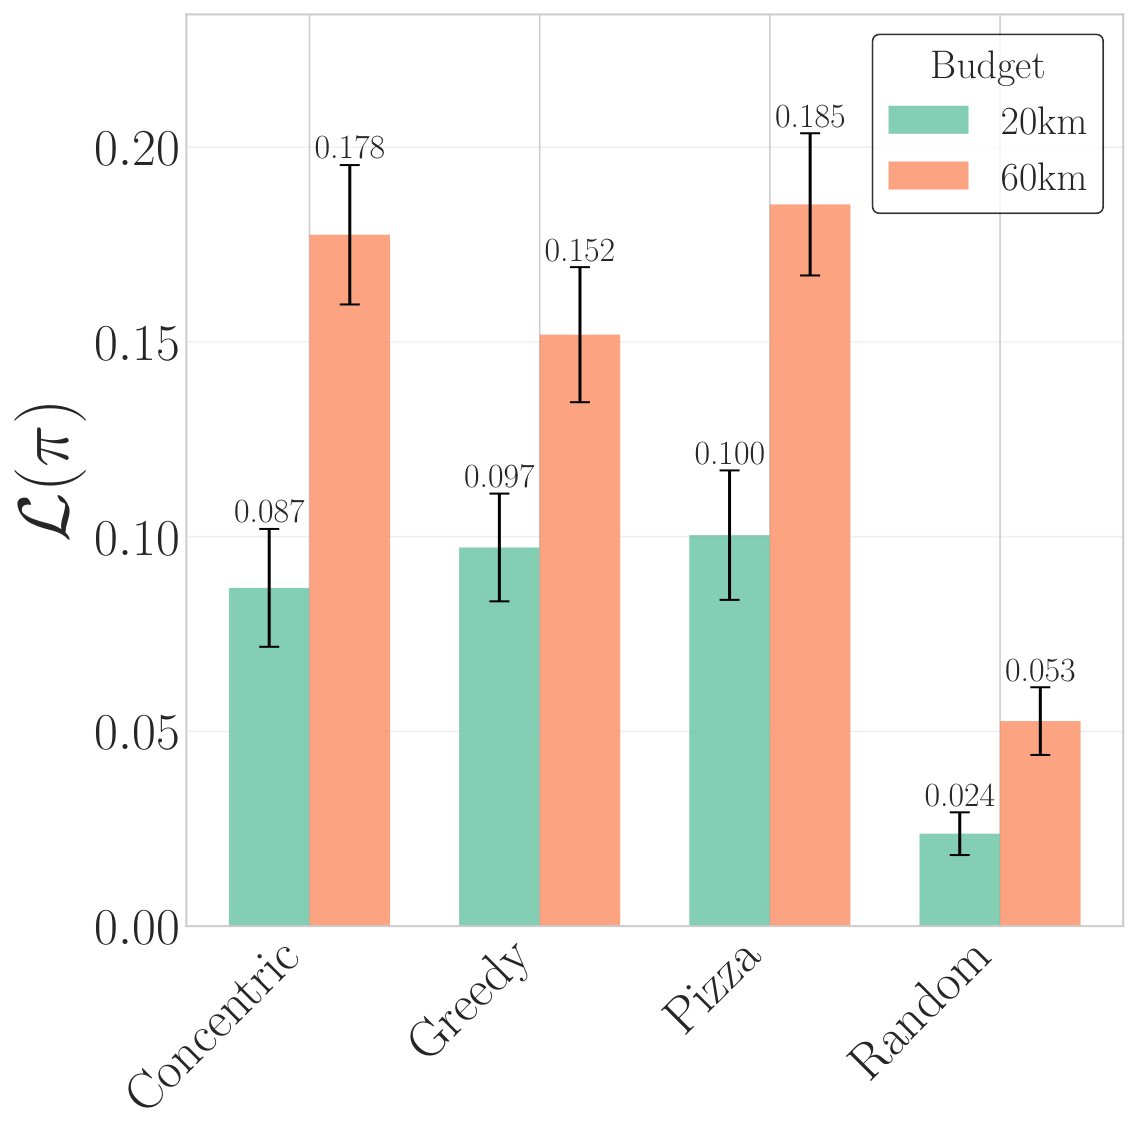
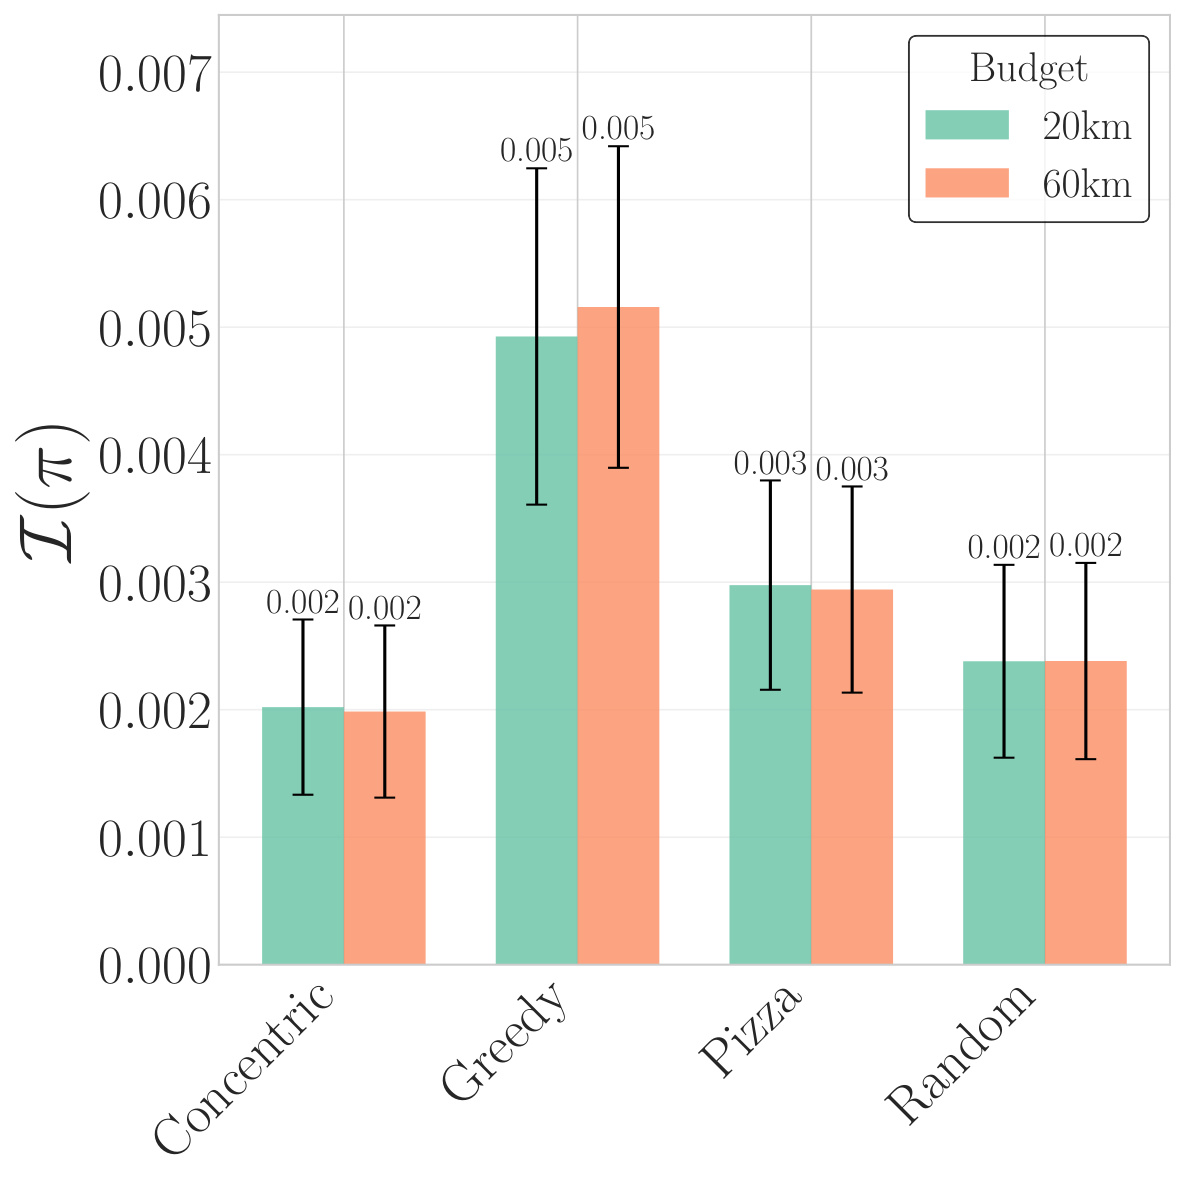
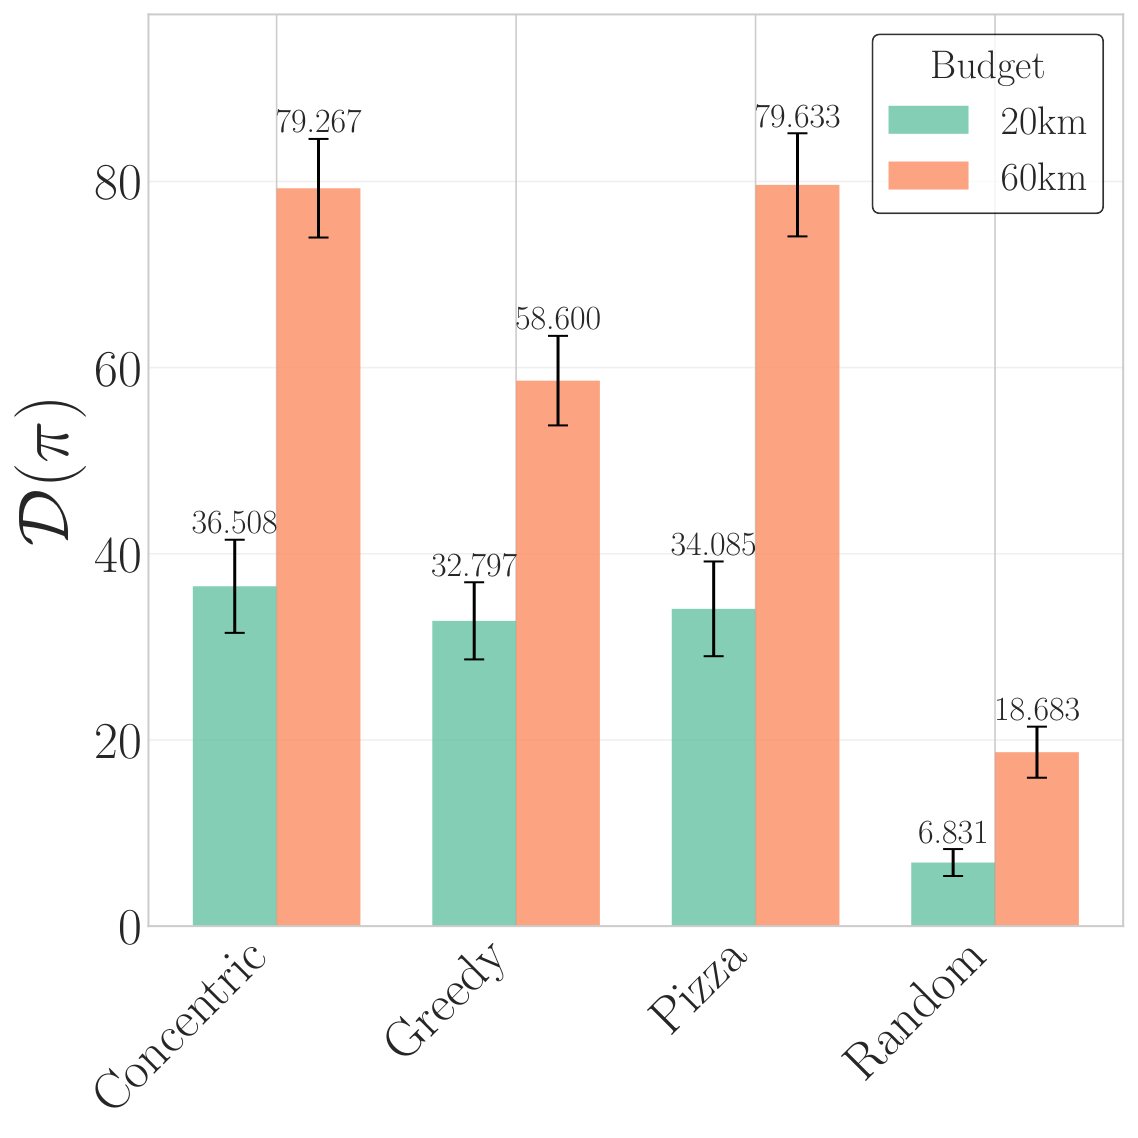
Figure 6 evaluates the baselines across the complete dataset of 60 environments: exhaustive methods generally outperform exploratory ones on accumulated probability of detection, but when the budget is tight — or the metric is time-discounted, favoring initial exploration — greedy and random exploration hold their own.La Figura 6 evalúa las líneas base en los 60 entornos del dataset: los métodos exhaustivos superan a los exploratorios en probabilidad acumulada de detección, pero con presupuesto ajustado — o métrica descontada en el tiempo, que favorece la exploración inicial — greedy y random exploration aguantan.
🎥 Video: SAREnv Demo & Evaluation Framework🎥 Video: SAREnv Demo & Evaluation Framework
The supplementary demo video walks through the complete framework end to end — the 60 environments, the four baseline search strategies, and their head-to-head evaluation. Watch it here: El vídeo demo suplementario recorre el framework completo de principio a fin — los 60 entornos, las cuatro estrategias de búsqueda base y su evaluación cara a cara. Míralo aquí:
The project is open source and lives under the NAMUR GitHub organization, growing out of the WildDrone/HERD collaboration with the University of Bristol. It's already being put to work: University of Bristol undergraduates extended and deployed SAREnv scenarios for their third-year projects, presented at the EuroDroS conference at SDU.El proyecto es open source y vive en la organización NAMUR de GitHub, nacido de la colaboración WildDrone/HERD con la University of Bristol. Ya está en uso: estudiantes de grado de Bristol ampliaron y desplegaron escenarios de SAREnv para sus proyectos de tercer año, presentados en la conferencia EuroDroS en la SDU.
2025 · Drones (MDPI)MDPIGitHubVideoVideo
K.A.R. Grøntved, A. Jarabo-Peñas, S. Reid, E.G.A. Rolland, M. Watson, A. Richards, S. Bullock, A.L. Christensen