During my MSc at KTH/UPM (a double degree, with the thesis carried out at Ericsson Research), I spent a lot of time thinking about graphs — knowledge graphs, IoT data flows, digital-twin architectures. And every time I wanted to show one, I hit the same wall: browser diagramming libraries were either heavy all-in-one solutions or canvas-based, which turned into pixel soup when zoomed in. Durante mi MSc en KTH/UPM (un doble grado, con la tesis en Ericsson Research), pasé mucho tiempo pensando en grafos — knowledge graphs, flujos IoT, arquitecturas digital-twin. Y cada vez que quería mostrar uno, chocaba con el mismo muro: las librerías de diagramas del navegador eran pesadas all-in-one o basadas en canvas, que al hacer zoom se volvían sopa de píxeles.
So I built my own pair of tools: jQuery Arrows, a tiny reusable plugin that draws stylable, curved SVG connectors between HTML elements, and Graph Sparrow, a full interactive graph editor built on top of it. Both are open source (MIT), and both have live demos on GitHub Pages — no setup, just open the page and drag a node. Así que construí mi par de herramientas: jQuery Arrows, un plugin pequeño reutilizable que dibuja conectores SVG curvos estilables entre elementos HTML, y Graph Sparrow, un editor de grafos interactivo que lo usa. Ambos open source (MIT), con live demos en GitHub Pages — sin setup, solo abre la página y arrastra un nodo.
📑 jQuery Arrows — SVG connectors that follow your nodes📑 jQuery Arrows — conectores SVG que siguen a tus nodos
jQuery Arrows is a jQuery plugin for adding stylable, curved SVG connector arrows with text tags between HTML elements. It started as the missing piece for visualizing relationships between elements and plotting graphs — without pulling in a full diagramming framework. jQuery Arrows es un plugin de jQuery para añadir flechas conectoras SVG curvas y estilables con text tags entre elementos HTML. Nació como la pieza que faltaba para visualizar relaciones entre elementos y dibujar grafos — sin meter un framework de diagramas completo.
- SVG-based, not canvas: crisp, resolution-independent connectors — zoom in as much as you like.Basado en SVG, no en canvas: conectores nítidos y escalables — haz zoom todo lo que quieras.
- Curved or straight: quadratic Bézier arches with a configurable
curvature(0 = straight line).Curvos o rectos: arcos de Bézier cuadráticos concurvatureconfigurable (0 = línea recta). - Text labels: names rendered along the path midpoint with SVG
<textPath>.Text labels: nombres en el punto medio del path con SVG<textPath>. - Live tracking: arrows follow elements on drag, resize, and scroll — a 60 FPS loop plus an instant jQuery UI drag hook.Live tracking: las flechas siguen a los elementos en drag, resize y scroll — loop 60 FPS + hook de drag de jQuery UI.
- Precise boundary anchoring: parametric ray-box intersection places arrowheads exactly on node borders — no gaps, no overshoot, robust to vertical/horizontal alignment.Anclaje preciso en bordes: la intersección ray-box coloca las puntas justo en el borde del nodo — sin huecos ni overshoot, robusto a alineación vertical/horizontal.
- Multi-select: connect collections of sources to collections of targets (cross product).Multi-select: conecta colecciones de fuentes y de targets (cross product).
- Fully stylable: color, dash, and width via plain CSS classes.100% estilable: color, dash y width con clases CSS.
- Lifecycle management:
update/removecommands plus automatic teardown when a node is removed. UMD build with TypeScript definitions.Lifecycle management: comandosupdate/removey teardown automático al eliminar un nodo. Build UMD con definiciones de TypeScript.
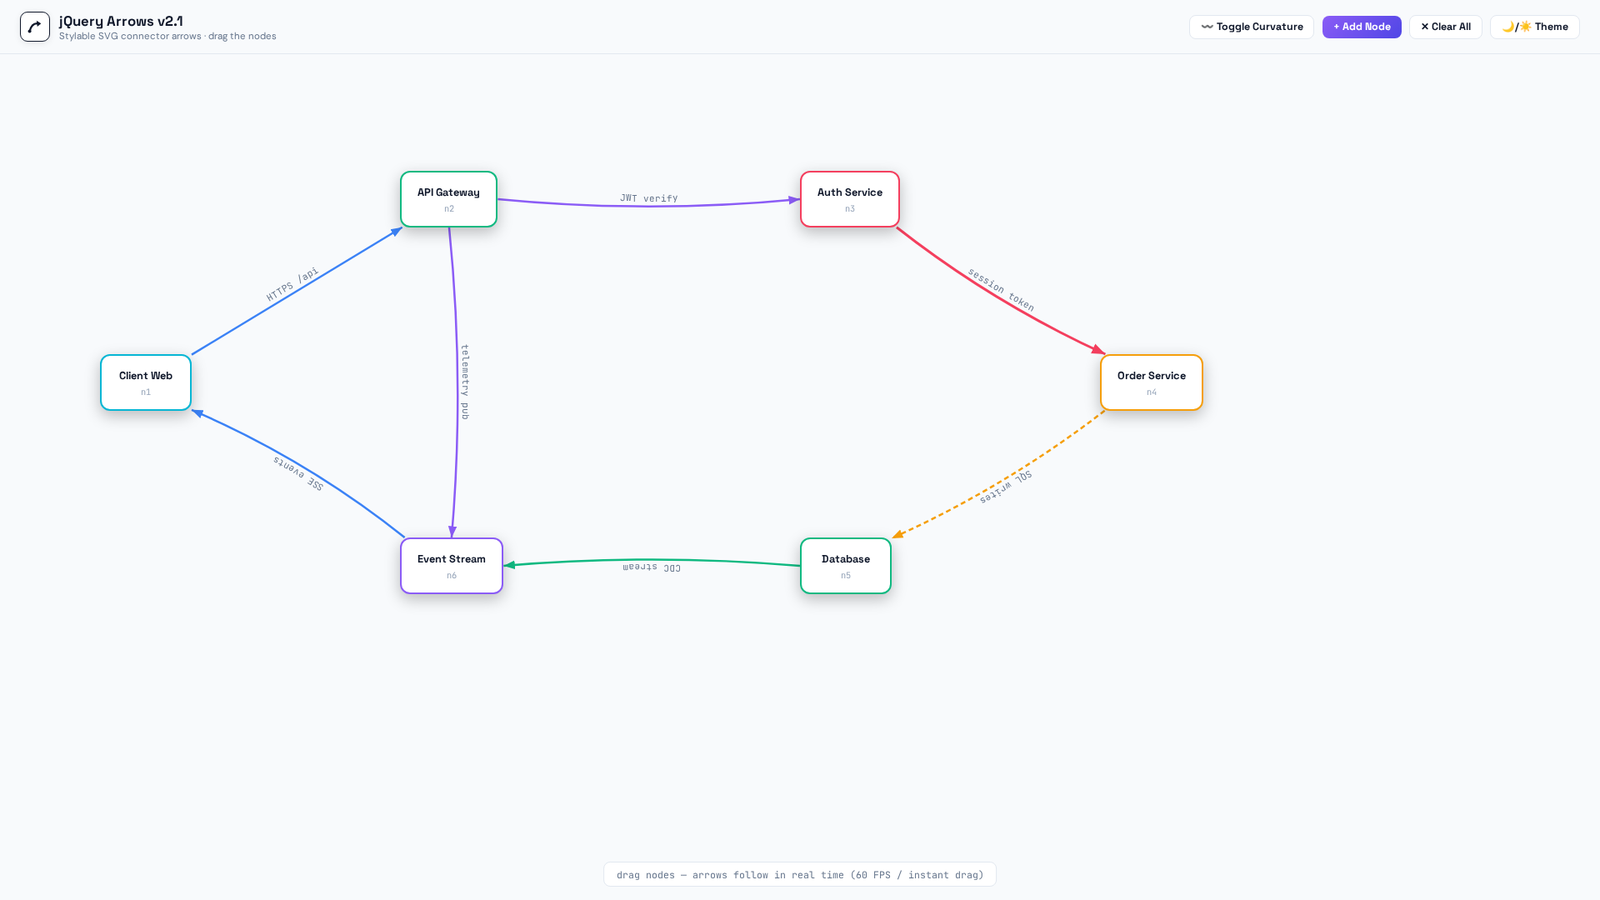
Quick start:Quick start:
$("#node-1").arrows({
  within: "#svg-arrows",   // container (default: body)
  id: "arrow-1-2",         // unique id
  class: "blue-dashed-edge", // arrow CSS class for styling
  name: "i am arrow-1-2",  // optional text label
  from: "#node-1",         // source (selector, node, or jQuery object)
  to: "#node-2",           // target
  curvature: 0.5,          // 0 = straight, >0 = arched Bézier
});
📜 Graph Sparrow — an interactive graph editor on top📜 Graph Sparrow — un editor de grafos interactivo
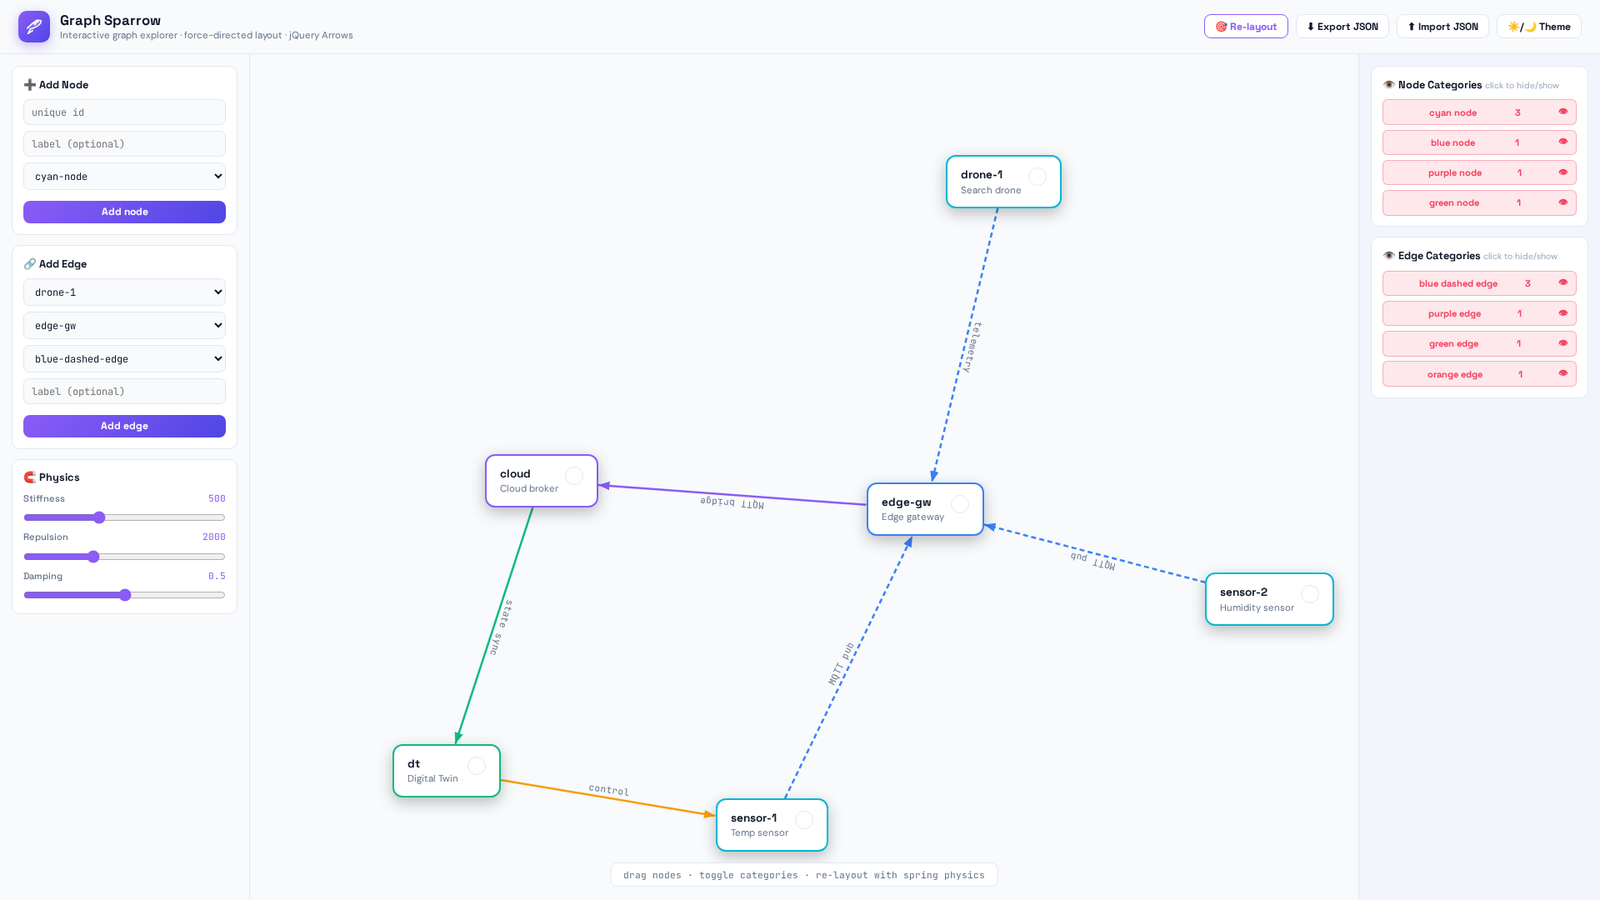
Graph Sparrow takes the plugin one step further: a full interactive graph visualization tool with built-in force-directed layout (via Springy), draggable nodes, category-based hide/show toggles, and JSON graph import/export — with jQuery Arrows drawing the live-following SVG connectors. Graph Sparrow va un paso más allá: una herramienta de visualización de grafos con force-directed layout integrado (vía Springy), nodos arrastrables, toggles de hide/show por categoría e import/export de grafos JSON — con jQuery Arrows dibujando los conectores SVG que siguen en vivo.
- Force-directed physics: spring stiffness, repulsion, and damping controls with deterministic synchronous layout ticks.Física force-directed: control de rigidez del spring, repulsión y damping con ticks de layout síncronos deterministas.
- Live SVG arrows: colored, labeled, dashed connectors that follow nodes while dragging (50 ms global update loop).Live SVG arrows: conectores de colores y discontinuos que siguen a los nodos al arrastrar (loop global de 50 ms).
- Category toggles: hide/show entire node and edge categories with one click.Category toggles: muestra u oculta categorías de nodos y edges con un clic.
- Graph serialization: export/import graphs as JSON, round-trip safe.Graph serialization: export/import de grafos JSON, round-trip safe.
- Dynamic editing: add nodes and edges through the sidebar forms with duplicate guards; removing a node cascades to its incident edges; hide/show moves nodes to a hidden pool.Edición dinámica: añade nodos y edges con formularios del sidebar y guards anti-duplicados; eliminar un nodo borra sus edges incidentes; hide/show mueve nodos a un pool.
- Cockpit UI: 100 vh locked layout, dark/light themes, no page scrollbars.Cockpit UI: layout 100 vh bloqueado, temas dark/light, sin scrollbars.
Out of the box it ships with six node categories (green, blue, red, cyan, amber, purple) and five edge
styles (blue-dashed, purple, orange, green, rose), all overridable in plain CSS — and a public API
(addNode, addEdge, exportGraph, importGraph,
reloadGraphLayout) for embedding it anywhere.
Incluye seis categorías de nodos (green, blue, red, cyan, amber, purple) y cinco estilos de edges
(blue-dashed, purple, orange, green, rose), todo personalizable en CSS plano — y una API pública
(addNode, addEdge, exportGraph, importGraph,
reloadGraphLayout) para integrarlo donde sea.
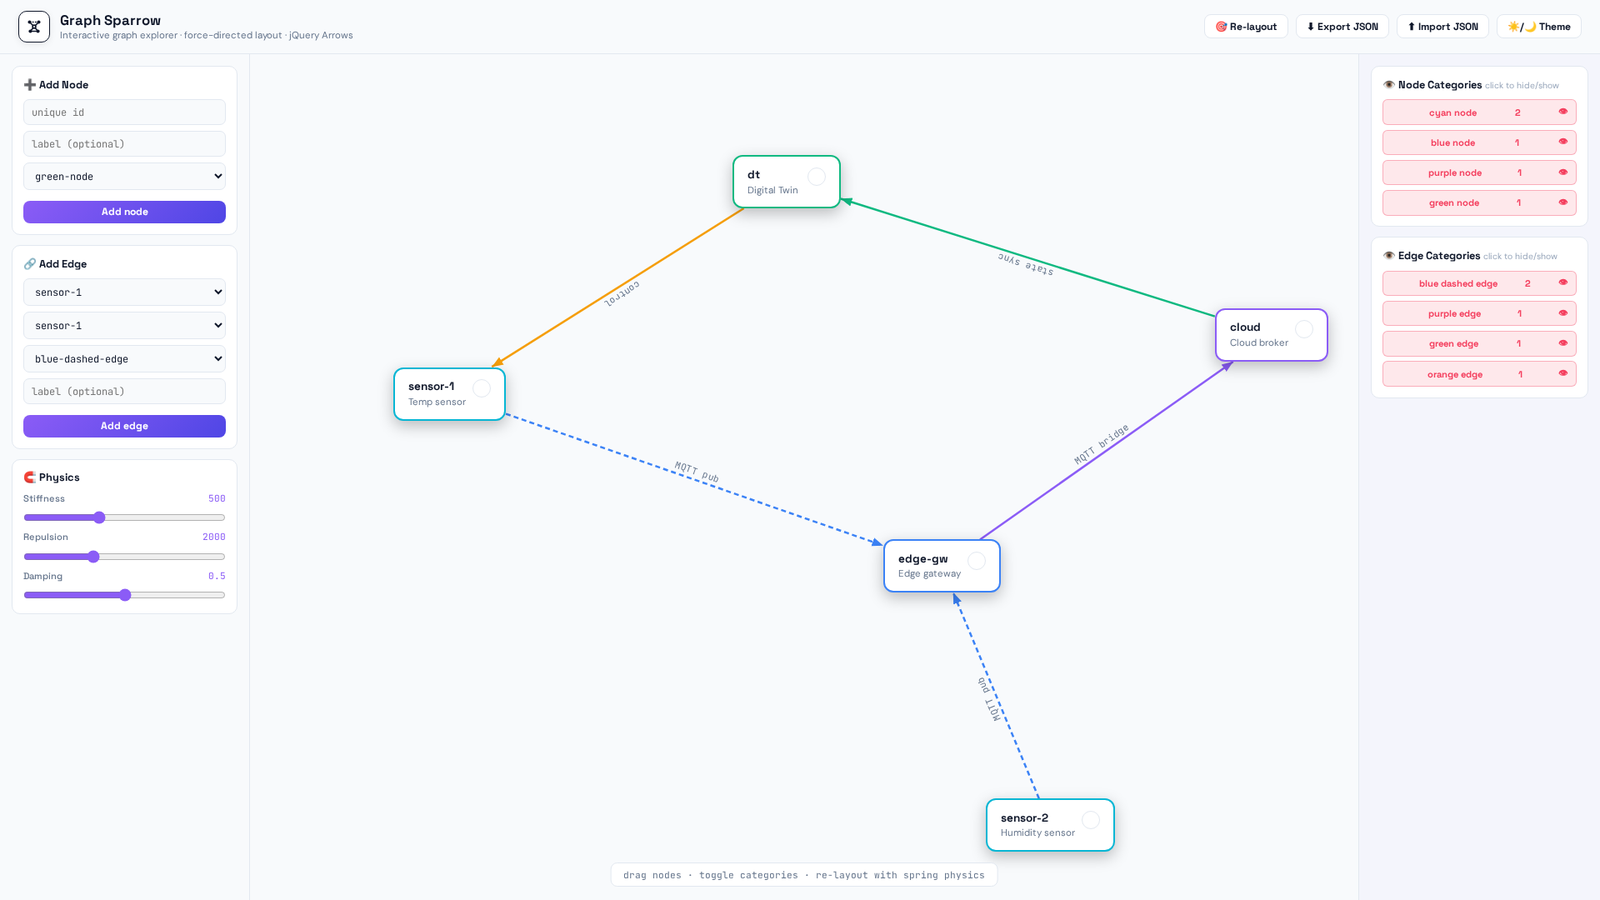
The screenshots above show the default IoT / digital-twin graph that loads on startup — sensor nodes feeding an edge gateway, a cloud broker, and a digital twin — and, after some editing, a drone-and-gateway graph with the sidebar forms, category toggles, and physics sliders in action. Las capturas muestran el grafo IoT / digital-twin por defecto al inicio — nodos sensor alimentando un edge gateway, un cloud broker y un digital twin — y tras editar, un grafo drone-and-gateway con los formularios del sidebar, category toggles y los sliders de física en acción.
🎉 What's new🎉 Novedades
The v2.1.0 release and the updates since keep adding polish to both projects: El release v2.1.0 y las actualizaciones siguen puliendo ambos proyectos:
- System theme by default: no more hardcoded dark theme — a tiny script reads
localStoragefirst and otherwise followsprefers-color-scheme, so the page matches the OS instantly with no flash. If the OS theme changes live, the page follows — until you manually override, which persists.System theme by default: adiós al dark theme hardcodeado — un script diminuto leelocalStoragey si no sigueprefers-color-scheme, la página iguala al OS al instante, sin flash. Si el tema del OS cambia en vivo, la página lo sigue — hasta que lo cambias manualmente. - Smarter Clear All: it now wipes the whole canvas — nodes, arrows, and bookkeeping — and Add Node correctly links to the first existing node (or creates a standalone one on an empty canvas).Smarter Clear All: ahora borra todo el canvas — nodos, flechas y bookkeeping — y Add Node enlaza con el primer nodo existente (o crea uno standalone en un canvas vacío).
- 📖 Guide button + modal: both demos now ship a built-in guide — what it is, how it works, how to use — right in the navbar, so visitors can drive the tools without reading the README first.📖 Guide button + modal: ambos demos traen una guía integrada — qué es, cómo funciona, cómo usarla — en la navbar, para que los visitantes usen las herramientas sin leer el README antes.
- jQuery Arrows — labels always readable: arrow labels are placed at the path midpoint with clamped rotation, so they never render upside down on leftward arrows.jQuery Arrows — labels always readable: las labels van en el punto medio del path con rotación limitada, y nunca salen boca abajo en flechas a la izquierda.
- Graph Sparrow — per-node controls: every node gets a visible ✕ remove button and an SVG eye/eye-slash hide toggle (no emojis, no icon fonts), wired via event delegation.Graph Sparrow — per-node controls: cada nodo tiene un botón remove ✕ visible y un ojo SVG como toggle hide (sin emojis ni icon fonts), vía event delegation.
- Live demos on GitHub Pages with badges in both READMEs — zero-setup interactive playgrounds.Live demos on GitHub Pages con badges en ambos READMEs — playgrounds interactivos sin setup.
- Test suites green: 17/17 (jQuery Arrows) and 13/13 (Graph Sparrow) unit tests.Test suites verdes: 17/17 (jQuery Arrows) y 13/13 (Graph Sparrow) unit tests.
GitHub · jquery-arrows GitHub · graph-sparrow Live Demo · jquery-arrowsLive Demo · jquery-arrows Live Demo · graph-sparrowLive Demo · graph-sparrow jQuery · SVG · Open SourcejQuery · SVG · Open Source